Document Developer - instructions > Making the document dynamic > Adding dynamic data to object properties > Using chart layers

Using chart layers
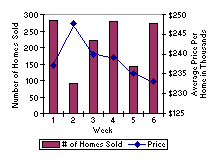
You can have multiple data layers in a chart, i.e. multiple graphs in the same chart, such as:
Click to enlarge
Click to enlarge
Figure 54
The following procedure describes how to achieve a bar/line-chart-combo as in the image above.
To create a chart with multiple layers
1
2
 
2
6
Series 0: Set a brown color
Series 1: Set a blue color
3
In X axes > Axis X 1 and Y axes > Axis Y 1, remove the Data label value.
4
In Support lines > Support lines 1, set the Line color to Transparent
5
Select the Data category and click the browse button. The Chart Data panel opens.
6
In Data label column, change values to 1, 2, and 3.
7
Set Label rotation to 0.
8
9
10
Set Type to Line.
11
In the Chart Data panel, select Series 2 and set Assigned chart layer to Layer 2.
12
OpenText StreamServe 5.6 Updated: 2013-03-01