|
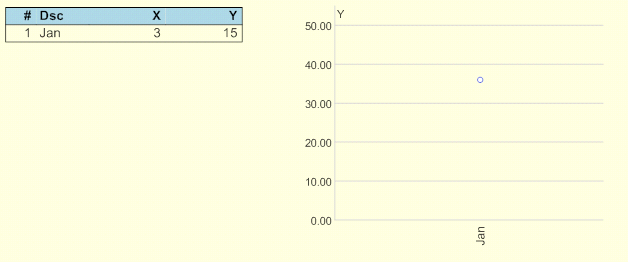
Figure 34
|
|
Figure 35
|
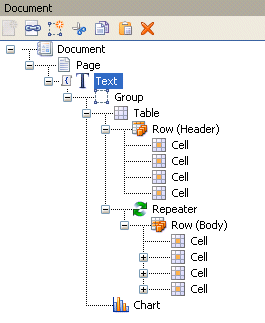
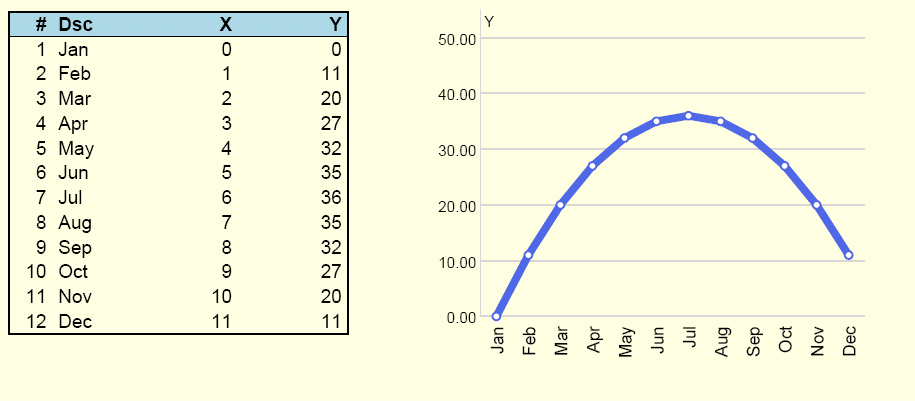
As the icon to the left of the Text object indicates, a script is added before the text area. The script tokenizes a string of month names into an array of the month names called $labels. It also creates two numeric arrays, $x and $y which are populated with specific numbers for each instance of the $labels array.
|
Example 22
|
$count = StrTok( "Jan,Feb,Mar,Apr,May,Jun,Jul,Aug,Sep,Oct,Nov,Dec", ",", $labels );
$i = 0;
while( num( $i ) < num( $count ) )
{
$x[$i] = $i;
$y[$i] = num($i) * (num($count) - num($i));
$i++;
}
The repeater that repeats the table body row has XPath $labels specified on it. The chart uses the same variable for the x-axis label modification. For each value of $labels, the body row is repeated and the curve is drawn.
|
Figure 36
|
For information on scripting functions, see the StreamServe Scripting Reference.


