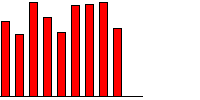
You define the color settings for arrays on the Array Options tab in the Chart Properties dialog box. If you do not define any color settings, gray scale shading will be used.
|
1
|
Click the Array Options tab.
|
|
2
|
Clear Automatic color shading.
|
|
3
|
Click the New button. A new color item is added to the list.
|
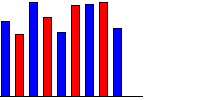
You can use multiple colors for chart items. The first color you define is used for the first item, the second color is used for the next item etc. When all colors have been applied, the first color is used for the next item etc.


|
1
|
Click the Array Options tab.
|
|
2
|
Clear Automatic color shading.
|
|
3
|
Click the New button. A new color item is added to the list.
|
|
5
|
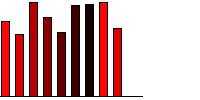
You can enable automatic shading of the colors you have added to the list. You use a shading offset value to define how much the shade will change between iterations – the lower the value, the smaller the change, and more shades are available.
If you use a single color, this color is used for the first item. The color is then gradually shaded, until no more shades are available. Then the original color is applied again.


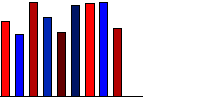
If you use two or more colors, each of the original colors are applied in the order in which they appear in the list. Then shades of the original colors are applied in the same order.


|
1
|
Click the Array Options tab.
|
|
2
|
Select Automatic color shading.
|
|
3
|
Enter a Shading offset value.
|


